10/02/2015

If statement is a branch that uses a control expression/statement which in turn permits us to select and execute specific block/blocks of code while skipping other block/blocks of code.

The if-construct has the following format:

if  control/logical_expression_1
    {
        ........... execute this block 1
        ........... execute this block 1
      }

elseif  control/logical_expression_2
      {
        ........... execute this block 2
        ........... execute this block 2
      }

else 
{
        ........... execute this block 3
        ........... execute this block 3
      }
 end

Some important rules/points about if-construct:

1-if statement is must to use and can occur only once i.e at the beginning.It also tells the position counter or controller that the if-construct has been started.
2-else statement may or may not occur according to our demand but it can occur only once i.e before  the end statement, if the if statements are not nested.
3-elseif statement can occur as many times as we require it.It will always occur between if and end statements.

How these statements work?

There is a simple reason behind working of these if, elseif and else statements.That will be explained in the following paragraph.
These if and elseif statements require a logical 1(in machine language it's mean true) for their code block to be executed and a logical 0(in machine language it's mean fasle) for their code block not to be executed.
These logical 1's and 0's are provided by control/logical expressions,these logical/control expressions are combinations of relational and logic operators which forms a condition, if this applied condition becoms true result will be logical 1 and if this a applied condition becomes false result will be logical 0, which will control the execution and non execution of code block related to if and elseif statements respectively.This is how these statements work basically.

Note: else statement don't require a control/logical expression.

If none of the code block is executed above else statement, then code block related to else statement is executed by program counter, if this statement and code block exists.

Where the use of end statement is just to mark the boundary or finish point of the if-construct.To tell the position counter or controller that after the execution of end statement the controller will be out of the if construct.

26/08/2014

how to have multiple plotting in matlab
Multiple plotting.
One of the most admirable features of MATLAB is its extensive device independent plotting capabilities. They make it very easy to plot any data or expression at any time. Any pair of vectors can be plotted versus each other as long as both vectors have the same length.
Here we will discuss......

How to have:

1-     Continuous Plots/graphs.
2-  Discrete Plots/graphs.
3-  Logarithmic scale Plots/graphs.
4-  Multiple plots/graphs.

 We will discuss each one of the plotting schemes one by one in detail along with respective code and examples.
Except this you will learn how to add legend, xlabel, ylabel and grid in your plot.Sorry to say that I am not gonna explain it here but by just visiting the code under each plot you will learn how to use them.

   Continuous Plots/graphs:

Continuous plots are those plots that are so smooth that the human eye is not able to find any space between any two points.
  General function for this purpose is: plot(vect1,vect2)
 Where vect1 and vect2 are the variable names of two vectors to be plotted versus each other. vect1 will define the x-axis and vect2 will define the y-axis in MATLAB. Please note that these variable names are not
fix and final.You can select variable names of your own choice. 
As an example of this illustration visit the given below figure for further assistance.
how to plot continuous plots using matlab.
An example of continuous plot.


MALAB code of above given plot:
clc
clear all
x=1:0.01:10;
y=sin(x.^2)./x;
plot(x,y,'m')
xlabel('x-axis')
ylabel('y-axis')
legend('Continuous plot from "Matlabforeng.blogspot.com"')


   Discrete Plots/graphs:

      Discrete plots are not so smooth, like continuous plots, they have discontinuity at certain points that can be detected by human eye.
  General function for this purpose is: stem(vect1,vect2)
Where vect1 and vect2 are the two vectors to be plotted versus each other. vect1 will define the x-axis and vect2 will define the y-axis in MATLAB.
As an example of this illustration visit the given below figure for further assistance on how to plot a discrete graph using MATLAB.

how to have a discrete plot in matlab
An example of discrete plot.
Matlab code of above given plot:
clc
clear all
x=1:20;
y=x.^2;
stem(x,y,'*m:')
xlabel('x-axis')
ylabel('y-axis')
legend('discrete plot from "Matlabforeng.blogspot.com"')


   Logarithmic scale plots:

It is possible to plot data in logarithmic scale as well as in linear scale in MATLAB. Logarithmic graphs are used to study large functions.There are 3 possible combinations for this purpose.Each combination is produced by a separate function.
All general functions for this purpose are given and discussed below.

1- semilogx(x,y):
 semilogx(x,y) function plots x data in logarithmic scale on x-axis and y data in linear scale on y-axis.
Where x and y are just names of variables.You can use any name as a variable.
 For further assistance on how to have logarithmic scale plots using MATLAB.
Visit:
How to have Logarithmic plot with x-axis in logarithmic scale using matlab
Logarithmic plot with x-axis in logarithmic scale.


You can see in the above given MATLAB's plot that x-axis is in logarithmic scale while y-axis is in linear scale.
MATLAB code of above given plot: 
clc
clear all
x=1:0.01:100;
y=sin(x.^2)./x;
semilogx(x,y,'m')
xlabel('x-axis')
ylabel('y-axis')
legend('Logarithmic scale plot from "Matlabforeng.blogspot.com"')
grid on

2-semilogy(x,y):
semilogy(x,y) is also a MATLAB's unique function to plot logarithmic graphs.This function plots y data/vector in logrithmic scale on y-axis but x data/vector in linear scale on x-axis.Where x and y are variable names that MATLAB uses to store and represent vectors and values.Please note that these variable names are not fix and final.You can select variable names of your own choise. 
For further assistance on how to have logarithmic scale plots using MATLAB.
Visit:
How to have a Logarithmic scale plot with logarithmic scale on y-axis using matlab.
Logarithmic scale plot with logarithmic scale on y-axis.


You can see in the above given MATLAB's plot that y-axis is in logarithmic scale while x-axis is in linear scale.
MATLAB code of above given plot: 
clc
clear all
x=1:0.01:100;
y=sin(x.^2)./x;
semilogy(x,y,'m')
xlabel('x-axis')
ylabel('y-axis')
legend('Logarithmic scale plot from "Matlabforeng.blogspot.com"')
grid on


3-loglog(x,y):
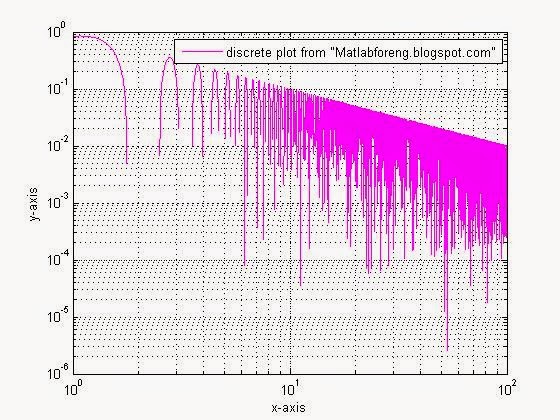
loglog(x,y) function is another MATLAB's unique function that enables you to examine large values.This function plots both x and y data in logarithmic scale on both x-axis and y-axis.
For further assistance on "how to have logarithmic scale plots with both axis is logarithmic scale using MATLAB".
Visit:
How to plot logarithmic graph with both axis in logarithmic scale
Logarithmic plot with both axis in logarithmic scale.


You can see in the above given MATLAB's plot that both axis are in logarithmic scale.
In legend I mistakenly wrote discrete plot, I confirm here that above given plot is also logarithmic scaled plot. 
MATLAB code of above given plot: 
clc
clear all
x=1:0.01:100;
y=sin(x.^2)./x;
loglog(x,y,'m')
xlabel('x-axis')
ylabel('y-axis')
legend('discrete plot from "Matlabforeng.blogspot.com"')
grid on
  Multiple plots/graphs:
Multiple plotting is a great feature, given to MATLAB users, a strong technique that enables us to plot more then 1 graph/plot on the same window.
General functions for this purpose are:
  1-plot(x1,y1,x2,y2,..),semilogx(x1,y1,x2,y2,..),semilogy(x1,y1,x2,y2,..),loglog(x1,y1,x2,y2,..).
         
  2-Hold on

We will discuss each one of them,

   plot(x1,y1,x2,y2,..),semilogx(x1,y1,x2,y2,..),semilogy(x1,y1,x2,y2,..),loglog(x1,y1,x2,y2,..):

I used to write all 4 functions in 1 heading because procedure to use them is same just their working is different.Where x1,y1,x2 and y2 are variables names of vectors whose graph you want to plot.First subscript defines x-axis while 2nd subscript defines y-axis and so on.With plot(x1,y1,x2,y2,..)
function you can only plot continuous graphs But with  semilogx(x1,y1,x2,y2,..),
semilogy(x1,y1,x2,y2,..) and loglog(x1,y1,x2,y2,..) you can plot logarithmic plots according to your demand, I am recalling here them again to show you that they can also plot multiple plots in 1 window.To show this I will provide you a picture and also a code that will yield that graph or picture.But all these functions are limited to plot the graphs of same category not a combination of different ones.
To plot any category of graph on the same window consider hold on command.
Note that we don't need to provide different colours to different vactors as MATLAB will automatically do this for us
To short my article I am explaining here how to use plot(x1,y1,x2,y2,..) and semilogy(x1,y1,x2,y2,..) functions try other two by your self, procedure to use them is same.
 For further assistance consider the given below graph and code:
how to plot Multiple continuous plots using matlab.
Multiple continuous plots.


MATLAB code for above plot:
clc
clear all
x=1:0.01:10;
y=100.*sin(x.^2)./x;
z=x.^2;
w=100.*cos(x);
plot(x,y,x,z,x,w)
xlabel('x-axis')
ylabel('y-axis')
legend('Multiple continuous plots from "Matlabforeng.blogspot.com"')
grid on
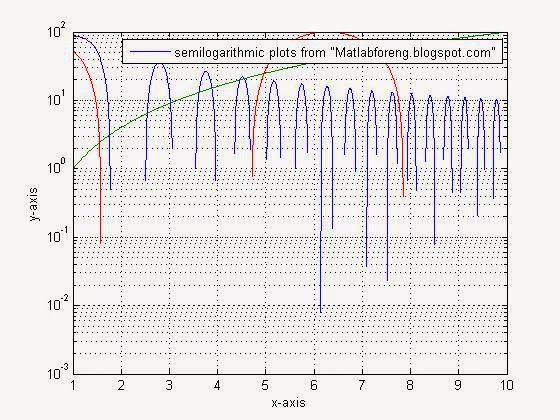
In case of semilogy(x1,y1,x2,y2,..)
how to plot multiple semilogarithmic plot using matlab
Multiple semi-logarithmic plot using matlab

MATLAB code:
clc
clear all
x=1:0.01:10;
y=100.*sin(x.^2)./x;
z=x.^2;
w=100.*cos(x);
semilogy(x,y,x,z,x,w)
xlabel('x-axis')
ylabel('y-axis')
legend('semilogarithmic plots from "Matlabforeng.blogspot.com"')
grid on
  Hold on
This is a strong command it has the power to plot more then one graphs of different categories in just 1 window ,other functions plot multiple plots of its own category,that's why it's different from other MATLAB functions.
As an example a plot along with code is shown below that includes continuous plot and discrete plot.
how to plot Continuous and discrete plot in one window using hold on command in matlab.
Continuous and discrete plot using hold on command. 
MATLAB code:
clc
clear all
x=1:1:50;
z=x.^2;
w=100.*cos(x);
stem(x,w,'r*')
hold on
plot(x,z,'g')
legend('discrete plot from "Matlabforeng.blogspot.com"','continuous plot from "Matlabforeng.blogspot.com"')
xlabel('x-axis')
ylabel('y-axis')
grid on
Please note that you could not use stem(x,y) function to have discrete multiple plots.You can just use hold on command for this purpose. 

07/08/2014

how to use end function,whats the end function,matlab shortcut key
MATLAB includes a special function named end, it’s very useful for creating array subscripts.End function when used in place of an array (row vector, column vector and matrix) subscript always returns maximum value that a subscript can have in accordance with size of respective array.

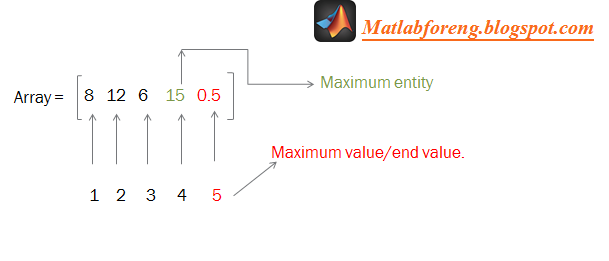
?It should be clear here that end function returns the maximum value that a subscript can have, not the maximum value/entity that an array (row vector, column vector and matrix) contains.
 E.g
How to construct subarrays using end function.,how to use end function,shortcut in matlab
Difference between maximum entity and maximum value.

When we will use the end function for the above mentioned array as last-value=Array(end), here end will return, as stated above, the maximum value that is 5 it will neither return 15 nor 0.5 because those are entities which that specific array contains but the maximum value which that subscript can hold is 5.Other examples using MATLAB are: 
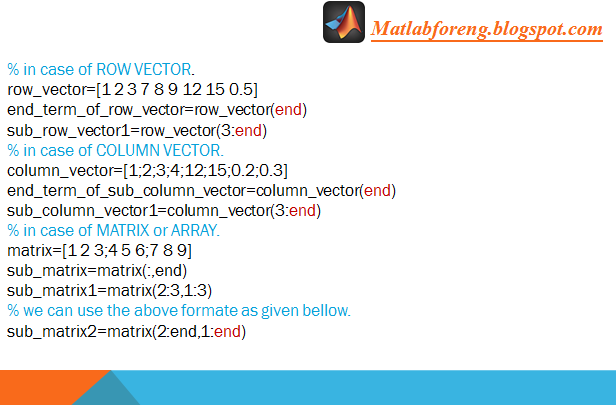
How to construct subarrays using end function,how to use end function,shortcut in matlab,shortcut key in matlab
How to use end function in MATLAB.
To download MATLAB code shown above click here.


21/07/2014

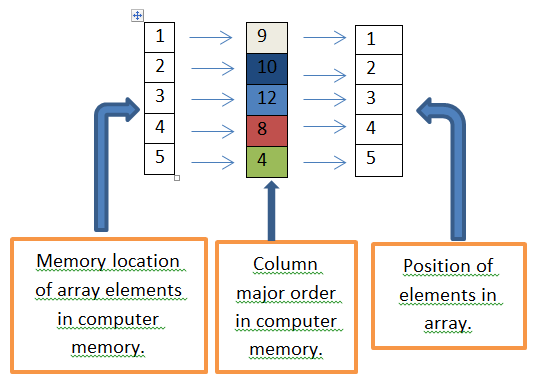
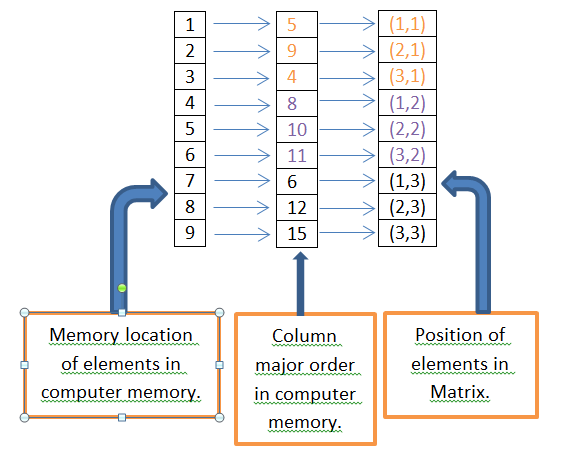
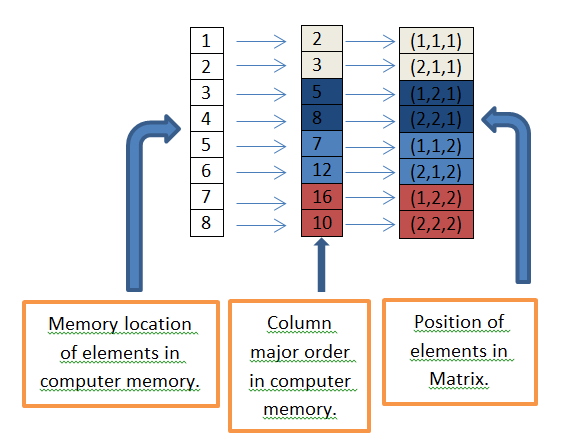
MATLAB always stores the single dimension and multidimensional arrays or matrix elements in column major order i.e MATLAB first allocates the first column in computer memory then it allocates the second column in computer memory and so on until all the columns of the respective array or matrix have been stored in computer memory.
 The following examples will better explain each and every thing what is stated above.
1 dimensional array:
                              These are the column vectors and row vectors.They can be visualized as a series of values laid out in a row or column, with a single subscript used to access individual array elements from computer memory
for example:  we have an array i.e
                                  
in computer memory it will be stored as
How MATLAB stores multidimensional arrays/matrix in computer memory.
This is how MatLab stores one dimensional array.


Where first column is representing memory locations(address) that MATLAB assigns to each element, 2nd column is explaining what is column major order principle that MATLAB follows to store elements in memory where each different color is representing different columns, and third column is used to represent position of elements in array that we use to access our elements from memory locations through MATLAB.
2 dimensional array/matrix:
for example we have a 3×3 matrix i.e

In computer memory it will be stored as stated "column major order" i.e explained below.
How MATLAB stores multidimensional arrays/matrix in computer memory.
This is how MatLab stores two dimensional array.
Again the first column is used to represent memory locations(address) that MATLAB assigns to each element, 2nd column is used to explain column major order principle that MATLAB follows to store array elements in computer memory where each different color is representing different columns, and third column is used to represent position of elements in array that we use to access our elements from memory locations.
3 dimensional array/matrix:
 suppose we have a 2×2×2 matrix, now you can see bellow that MATLAB  stores it in the same way.
How MATLAB stores multidimensional arrays/matrix in computer memory.
This is how MatLab stores three dimensional array.


Now again you can see that the first column is used to represent memory locations(address) that MATLAB assigns to each element, 2nd column is used to explain column major order principle that MATLAB follows to store array elements in computer memory where each different color is representing different columns, and third column is used to represent position of elements in array that we use to access our elements from memory locations.

All higher level multidimensional arrays are stored in the same way.


16/07/2014

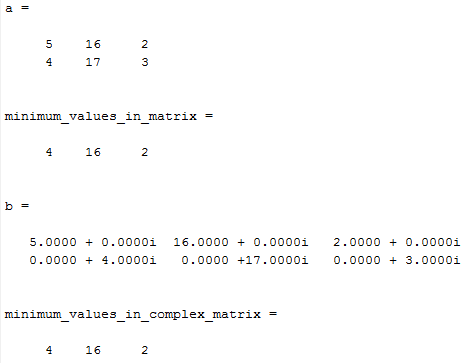
In MATLAB we use the following commands under certain conditions to find minimum values.
General form:
                    min(X)  or min(abs(X))
Where X can be any thing it can be a matrix or row vector or a column vector.
In case of matrix: 
                                  min(X) will return us minimum value of each column.If X is complex no.then we will use given command as min(abs(X)).
In case of row vector:
                                         min(X) will return us one a single value that will the minimum value in that row vector.If X is complex no.then we will use given command as min(abs(X)).
In case of column vector:
                                             min(X) will return us one single value that will the minimum value in that column vector.If X is complex no.then we will use given command as min(abs(X)).
How to find minimum values or entity in matrix/row vector and column vector using MATLAB.
result of MATLAB code given below.


Click here to download the m-file of above program.

12/07/2014

To know about how to extract a column from an array or matrix in MATLAB consider the following form i.e
        variable-name=matrix-name(rows,columns)
where:  

  ?  Variable-name:
                             It  shows the place where you can name your variable in which you wanna                                  store your extracted data.

  ?  Matrix-name:
                       It shows the place where you have to place your matrix name or array name from which you                          wanna extract your desired data.
  ?              ( ):
                      we use these parenthesis to send a command to MATLAB that we are gonna tell you the                             address in terms of rows and columns of an array/matrix.
  ?          Rows:
                      It shows the place where you have to put the position of your desired row (e.g 1st row or 2nd                                           row etc) of a matrix/array that you wanna extract,.we will use : in this place  which means                          each row.
  ?      Columns:
                      It shows the place where you have to put the position of your desired column(e.g 1st column or 2nd                                 column etc) of a matrix/array that you wanna extract.
Forexample:
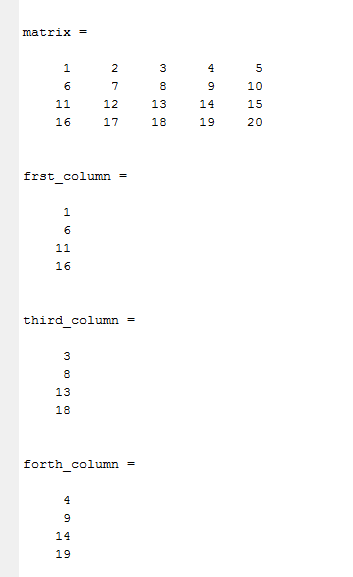
How to extract a column from a matrix/array in MATLAB.
Result of given below MATLAB code(how to extract column from matrix using MATLAB)

To know about how to extract a row from an array or matrix in MATLAB consider the following form i.e
        variable-name=matrix-name(rows,columns)
where:

?  Variable-name:
                             It  shows the place where you can name your variable in which you wanna                                  store your extracted data.

  ?   Matrix-name:
                       It shows the place where you have to place your matrix name or array name from which you                          wanna extract your desired data.
  ?               ( ):
                      we use these parenthesis to send a command to MATLAB that we are gonna tell you the                             address in terms of rows and columns of an array/matrix.
  ?          Rows:
                      It shows the place where you have to put the position of your desired row (e.g 1st row or 2nd                                           row etc) of a matrix/array that you wanna extract.
  ?     Columns:
                      It shows the place where you have to put the position of your desired column(e.g 1st column or 2nd                                 column etc) of a matrix/array  that you wanna extract.we will use : in this place  which means  each column.
e.g 
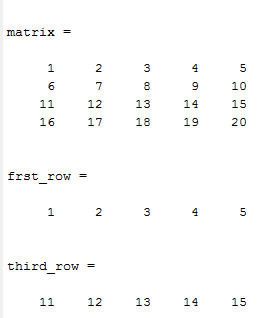
How to extract a row from a matrix or array in MATLAB.
Result of  given below MATLAB code.


  To download MATLAB code as a detailed example click below:

Blog Archive

Popular Posts